Project Analysis Report
Authors: Connie, Laura, Rachel, Ekta, Tianna
Background
The rate of drug-related deaths in Connecticut is currently higher than the national average and has continued to steadily increase. While there have been a significant number of initiatives implemented to reduce drug misuse in recent years, it is important to understand the demographic and geographic attributes underlying this public health issue to effectively reduce drug-related deaths in vulnerable populations.
Initial Questions
- What are the demographic characteristics of individuals who experienced a drug-related death in Connecticut?
- Where are these deaths mainly occurring within the state?
- Are there seasonal variations in deaths across each year?
- What specific drug types have been attributed to the increase in drug-related deaths?
Data
To address our initial research questions, we were interested in specific variables within the Accidental Drug Related Deaths dataset after tidying and cleaning. Variables used included attributes and characteristics of individuals at the time of death, details of the location of death, and type of drug used before death.
Below is a list of variables used in alphabetical order:
age: Age of individual at death
death_city_long and death_city_lat: Location of death by longitude and latitude
drug: Type of drug which includes heroin, fentanyl, cocaine, ethanol, benzodiazepine, and other
location: Location of death categorized by location type including nursing home, hospice, or convalescent home and residence, and hospital, and others.
month and year: Details of the date of death
race: Race of individual which include White, Black, Hispanic White, Asian, Hispanic Black, and other
sex: Sex of individual which include male, female, or unknown
Exploratory Analysis and Findings
Temporal analysis of deaths from 2012-2018
- Chart A shows that there is a growing number of Drug-Related Death in Connecticut from 2012 - 2018.
- Specifically, among all races, the white has the most progressive growth of Drug-Related Death (in exponential trend), compared to other races.
- Interestingly, there is an obvious drop of drug-related death in Connecticut in 2017 among all race groups and a rebound of drug-related death after 2018 in all race groups, except white.
Distribution of death by race, gender, age
- Chart B shows the distribution of age in drug-related deaths. From the graph, we can see that most of the drug-related deaths happen at the age between 25 and 50.
- Chart C shows the sex distribution in drug-related deaths. From the graph, we can see that males always outnumber females in the number of deaths across all race groups.
- Chart C also shows that there exists a distinct variation in drug-related deaths across gender specifically among white.
Age of death attributed to each drug type
- Chart D shows the distribution of age of death by different drug types. From the chart, we can see that:
- Fentanyl and Heroin are frequently used by younger age group (below 25 years old)
- Cocaine and Ethanol are widely used by older age group (40 to 45 years old)
- There is a wide age variation in Benzodiazepine-related death.
Spider-plot
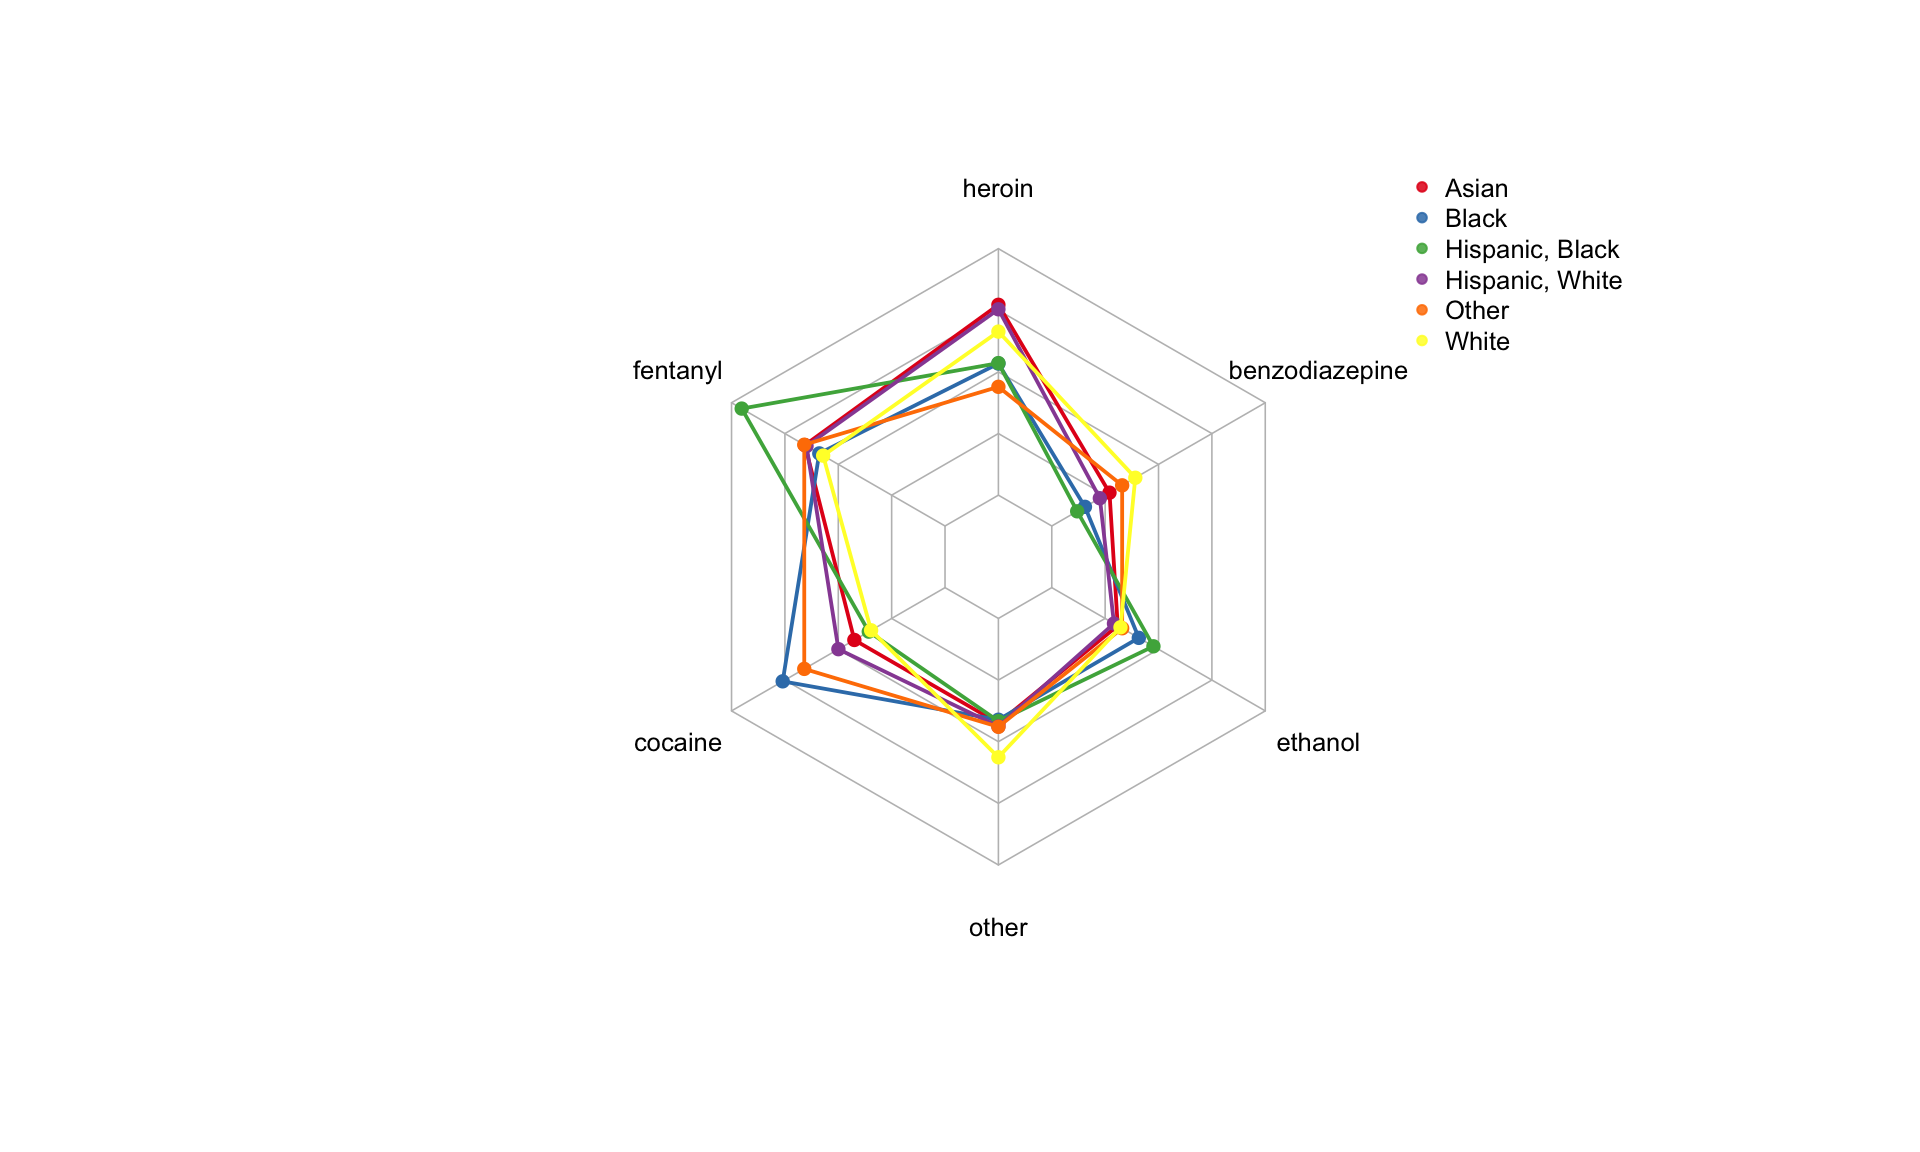
The spider plot above shows the different components of drug use in different race groups. We can see: * Hispanic-Black has a higher proportion of Fentanyl-related death, as compared to other race groups. * Both Asian and Hispanic-White have a high proportion of Heroin-related death, as compared to other race groups. * Black and Other race groups have a high proportion of Cocaine-related death, as compared to other race groups. * White has a high proportion of Heroin-related and Other-drug-related death, as compared to other race groups.
Location of death across Connecticut
When examining the distribution of deaths at different location types using map visualization, the large majority of death counts are found within personal residences and locations labeled as “other”. Other locations range from public spaces such as restaurants, hotels, and outside land plots, as well as residences of parents or friends. Across all location types, the highest distribution of deaths is found in Hartford, CT. The highest death count, 607 deaths, is found among residences in Hartford, CT.
In addition, the highest distribution of residence deaths are found along major highways near or within the following additional cities: New Haven, Waterbury, Norwich, and Bridgeport. Similarly, deaths at other locations are mainly concentrated within Hartford, New Haven, Waterbury, Norwich, and Bridgeport. The highest number of deaths at other locations are found near Hartford with a death count of 238 and near New Haven with a death count of 195. For the distribution of deaths at hospice, nursing homes, and convalescent homes, only five death counts were recorded. Two of these deaths were in Hartford, one death in Waterbury, one death in Wallingford, and one death in New Haven. Lastly, 34 deaths were reported at hospitals in CT. Single death counts at hospitals are distributed across the state, with the highest death count of 4 deaths occurring at hospitals near Hartford, CT.
Regression Analysis
# specify predictor variable types and set reference categories by frequency
drug_death_bin =
drug_death_bin %>%
  mutate(
    age = as.numeric(age),
    sex = fct_infreq(sex),
    race = fct_infreq(race),
    new_county = fct_infreq(new_county)
    )

# logistic regression model
model=
  glm(death_location ~ age + sex + race + new_county, data = drug_death_bin, family = "binomial")
# all ORs and betas from the model
model %>%
broom::tidy() %>%
mutate(OR = exp(estimate)) %>%
select(term, log_OR = estimate, OR, p.value) %>%
knitr::kable(digits = 3)| term | log_OR | OR | p.value |
|---|---|---|---|
| (Intercept) | 0.954 | 2.595 | 0.000 |
| age | 0.006 | 1.006 | 0.049 |
| sexMale | -0.188 | 0.829 | 0.028 |
| sexUnknown | 10.217 | 27351.427 | 0.959 |
| raceAsian | -0.600 | 0.549 | 0.000 |
| raceBlack | -0.655 | 0.519 | 0.000 |
| raceWhite | -0.419 | 0.658 | 0.286 |
| raceHispanic, White | -0.304 | 0.738 | 0.548 |
| raceOther | -0.464 | 0.629 | 0.529 |
| new_countymiddlesex | -0.312 | 0.732 | 0.002 |
| new_countylitchfield | -0.404 | 0.668 | 0.000 |
| new_countynew haven | -0.217 | 0.805 | 0.133 |
| new_countytolland | -0.323 | 0.724 | 0.058 |
| new_countynew london | 0.167 | 1.182 | 0.412 |
| new_countyout of state | 0.151 | 1.163 | 0.497 |
| new_countyfairfield | 0.034 | 1.035 | 0.882 |
| new_countywindham | -0.476 | 0.621 | 0.026 |
Logistic Regression Model and Covariate of Interest
In order to understand the likelihood of a drug related death occuring in the hospital versus not in the hospital, we binarized the variable death_location as the outcome (1 = In the hospital, 0 = Not in the hospital). For this logistic regression analysis we used a generlized logistic model with the predictors age, sex, race and county of residence. Age was treated as a continuous variable. Sex was categorical (Male, Female, and Unknown) with Male as the reference category based on frequency. Race was categorical with White, Black, Hispanic White, Asian, Other, Hispanic Black; White was the reference category based on frequency and NAs were dropped pre-analysis (n= 16). Finally the 8 Counties of CT were converted to factor variables with all other counties being converted to “out of state” with Litchfield Country as the reference variable based on frequency, NAs were dropped (n= 7).
Significant Results from the Logistic Regression Model
The significant variables in the model (p-value < 0.05) were age, Female, Hartford and New London Counties and the “Out of State” category.The odds of dying in the hospital from an overdose decrease by 0.05 for every 1-year increase in age. The odds of dying in the hospital as a female are 1.2 times the odds for men controlling for other covariates. Based on location the odds of dying in the hospital are 1.5 in Hartford, 1.8 in New London and 1.7 for out of state residentess compared to Litchfield county and accounting for other covariates.
Discussion and Further Questions to Consider
Through this assesment of accidental drug-related deaths within the state of Connecticut, we highlighted multiple points of interest that could then be utilized for potential intervention or additional analyses. Significant findings to further consider as research questions include but are not limited to:
- What are possible reasons, if any, for the small dip in drug-related deaths in Connecticut in all races group in 2017?
- Are there social determinants or availability factors that contribute to the different usage patterns (the type of drug, the age of drug-related death) across race groups?
- Could emergency response professionals utilize the maps to create better protocol to reduce instances of death upon arrival and overdose-related deaths overall?
- Some potential limitations include : Dataset does not specify what ‘other’ drugs were; potential underestimation of death count among disadvatnaged populations; and a farily limited number of variables included.